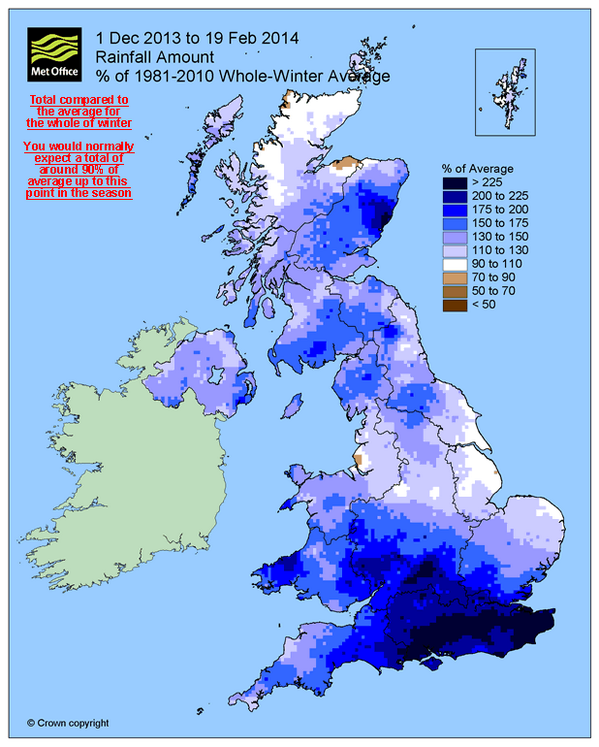
This has just been tweeted, it shows the really wet area is quite small and large areas (including here) have only been a bit wetter than average.
But because the wet area is in the SE we have heard nothing else for weeks.
Originally Posted by: Sevendust
Sorry have to disagree with that slightly. There is a significant amount of England, Wales and Scotland that are in the blue shaded area for 130 to 150% of rainfall. I would guess in the next blue shaded area for 150 to 175% of rainfall you have just under half of England, Wales and Scotland. To me that is not just the SE and is noteworthy country wide! Certainly those in Somerset, Worcestershire, Aberystwyth, Cornwall etc. would have something to say about it being perceived as just the SE I would imagine.........
Interesting map and does show that some areas have been only slightly above average, as you point out, but also large swathes more than slightly above average and still 8 days to go!

Originally Posted by: Deep Powder