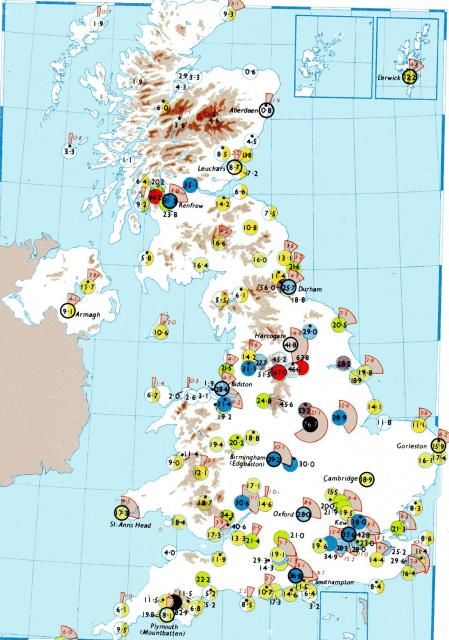
I mentioned in Kevin Bradshaw's thread (least memorable weather) that fog seemed once to be much more of a feature making years memorable. The Clean Air Act has obviously improved things, but I still think that the map below shows a more foggy country than in recent years. Anyway, here are the data to back up my claim.
Numbers in circles - days of fog, annual averages over 20-28 years to 1960 depending on station. The number in the black circle (Derby or Nottingham?) is 76.7!
Outer quadrant - days of thick fog. Numbers may not be easily visible even if you zoom in, but a complete outer circle corresponds to 30 days.

Originally Posted by: DEW