Remove ads from site

Gandalf The White
04 January 2020 18:07:26


Because this sort of pattern is easier for the models to handle, and has been pretty much consistent bar the occasional rogue run for several weeks.


There is no end in sight, and I really do think that we are running out of time. At the very least we have at least 10-14 more days of this pattern, that takes us close to February.


And I just can't see a way out of this pattern and winter is just not coming this year, until northern blocking no doubt returns in time for spring.


Originally Posted by: moomin75 


Strictly speaking it takes us to between 14th and 18th January, and that assumes the models are reliable in that extended timeframe, which they aren't.


So, if the model output verifies, we will be just about half-way through winter without any really cold weather. Bearing in mind we can get very cold weather well into March, this is far from over.


Location: South Cambridgeshire
130 metres ASL
52.0N 0.1E


Brian Gaze
04 January 2020 18:08:03


As I understand it those charts are derived from the model output, not an independent dataset.


Originally Posted by: Gandalf The White 


They are. I think some people misunderstand the NAO forecasts and sadly I have to include one or two well known broadcast meteorologists. The NAO forecast is simply a measure of pressure patterns which are being forecast by the (in this case) GFS model. Some people apparently think it actually exists as a forcing mechanism like SSTs.


Brian Gaze
Berkhamsted
TWO Buzz - get the latest news and views 
"I'm not socialist, I know that. I don't believe in sharing my money." - Gary Numan
nsrobins
04 January 2020 18:21:43

[edit removed]


Neil
Fareham, Hampshire 28m ASL (near estuary)
Stormchaser, Member TORRO
nsrobins
04 January 2020 18:24:09


They are. I think some people misunderstand the NAO forecasts and sadly I have to include one or two well known broadcast meteorologists. The NAO forecast is simply a measure of pressure patterns which are being forecast by the (in this case) GFS model. Some people apparently think it actually exists as a forcing mechanism like SSTs.


Originally Posted by: Brian Gaze 


And despite repeated explanations ad infinitum.


I wonder sometimes if some people actually read what’s posted here.


Neil
Fareham, Hampshire 28m ASL (near estuary)
Stormchaser, Member TORRO
Gandalf The White
04 January 2020 18:29:29


And despite repeated explanations ad infinitum.


I wonder sometimes if some people actually read what’s posted here.


Originally Posted by: nsrobins 


Along with sudden stratospheric warmings which are neither sudden nor particularly warm and have no effect on the troposphere.


Alongside Bartlett patterns, which mostly are nothing of the sort (even the current pattern is only marginal)


Meanwhile, back on topic (and supporting the point that we're not really in a true Bartlett pattern), ECM offers some weather interest for Thursday, with wintry weather likely on the northern flank with elevation:


Location: South Cambridgeshire
130 metres ASL
52.0N 0.1E


dagspot
04 January 2020 18:56:04

ECM offers some weather interest for Thursday, with wintry weather likely on the northern flank with elevation

Originally Posted by: Gandalf The White 


So maybe 'The Sun' and their predictions for snowmageddon next week were correct after all wink


Neilston 600ft ASL
White Meadows
04 January 2020 18:56:07
Personally I think the NAO & AO graphs are useful indicators for overall pattern changes. Not everyone’s cup of tea but their benefits shouldn’t be totally ignored. Recently it seems to have become treated almost as a banned talking point, irritating or even rage inducing subject (?)
doctormog
04 January 2020 19:08:02

Personally I think the NAO & AO graphs are useful indicators for overall pattern changes. Not everyone’s cup of tea but their benefits shouldn’t be totally ignored. Recently it seems to have become treated almost as a banned talking point, irritating or even rage inducing subject (?)

Originally Posted by: White Meadows 


It’s not that, it is the problem or confusion that arises when people comment on the GFS and then someone else points out that “the NAO forecast is positive as well” in a way that suggests it is entirely different output rather than exactly the same output presented in a different manner. The NAO forecasts should not be used as “extra evidence” (in combination with the GFS) for a picture of the current model output. They are a handy snapshot but are only as useful as the contemporaneous GFS data.


Gandalf The White
04 January 2020 19:29:29

Personally I think the NAO & AO graphs are useful indicators for overall pattern changes. Not everyone’s cup of tea but their benefits shouldn’t be totally ignored. Recently it seems to have become treated almost as a banned talking point, irritating or even rage inducing subject (?)

Originally Posted by: White Meadows 


Nothing 'rage inducing' about it, merely the fact that it gets routinely misinterpreted as carrying some sort of special meaning over and above what the models are showing when it isn't the case.


But it is worth saying that a positive NAO doesn't guarantee mild conditions Just as a negative NAO doesn't guarantee cold conditions.  You can get an easterly out of a positive NAO and mild southerlies out of a negative one, so like everything else it shouldn't really be used in isolation.


It is the same as those week 1 and week 2 temperature and rainfall charts; there also just another representation of the output - and arguably a more useful summary of likely average conditions.


Location: South Cambridgeshire
130 metres ASL
52.0N 0.1E


Arcus
04 January 2020 19:29:32


It’s not that, it is the problem or confusion that arises when people comment on the GFS and then someone else points out that “the NAO forecast is positive as well” in a way that suggests it is entirely different output rather than exactly the same output presented in a different manner. The NAO forecasts should not be used as “extra evidence” (in combination with the GFS) for a picture of the current model output. They are a handy snapshot but are only as useful as the contemporaneous GFS data.


Originally Posted by: doctormog 


Indeed. It's the equivalent of looking a set of football results and then looking at the league table and marvelling that they seen to correlate.


Anyway, ECM tries to thread the needle again toward heights to the NE with help from the north, but it's more runs needed...


Ben,
Nr. Easingwold, North Yorkshire
30m asl
Gandalf The White
04 January 2020 19:30:31


So maybe 'The Sun' and their predictions for snowmageddon next week were correct after all wink


Originally Posted by: dagspot 


LOL. Does The Sun get delivered to villages in the hills of northern Scotland?


Location: South Cambridgeshire
130 metres ASL
52.0N 0.1E


doctormog
04 January 2020 19:32:36


LOL. Does The Sun get delivered to villages in the hills of northern Scotland?


Originally Posted by: Gandalf The White 


Well they need something to burn surely? 


Gandalf The White
04 January 2020 19:36:16


Well they need something to burn surely? 


Originally Posted by: doctormog 


Are they out of election material by now?


wink


Location: South Cambridgeshire
130 metres ASL
52.0N 0.1E


White Meadows
04 January 2020 19:37:19


It’s not that, it is the problem or confusion that arises when people comment on the GFS and then someone else points out that “the NAO forecast is positive as well” in a way that suggests it is entirely different output rather than exactly the same output presented in a different manner. The NAO forecasts should not be used as “extra evidence” (in combination with the GFS) for a picture of the current model output. They are a handy snapshot but are only as useful as the contemporaneous GFS data.


Originally Posted by: doctormog 

I must have missed those posts- thought it was common knowledge those graphs derive from the same data. It’s just a different perspective of the same data- always useful to have another angle at your disposal. 

David M Porter
04 January 2020 19:39:19


Strictly speaking it takes us to between 14th and 18th January, and that assumes the models are reliable in that extended timeframe, which they aren't.


So, if the model output verifies, we will be just about half-way through winter without any really cold weather. Bearing in mind we can get very cold weather well into March, this is far from over.


Originally Posted by: Gandalf The White 


Indeed Peter. One only has to look back to events nearly two years ago to find an instance of a major wintry blast coming very late in the season.


It's also worth remembering that even some notably mild winters of the past 30 years were followed either at the end of the winter or in  early-mid spring by a cold spell. IIRC this happened in 1989, 1990, 1998 and 2008, the last of which saw a cold spell commencing just after mid-March and then lasting until well into April.


Lenzie, Glasgow

"Let us not take ourselves too seriously. None of us has a monopoly on wisdom, and we must always be ready to listen and respect other points of view."- Queen Elizabeth II 1926-2022
jhall
04 January 2020 22:03:34

I've been looking through the CET monthly means for past Januaries and Februaries, to see what the biggest falls from one month to the next have been. In recent times, they seem to have been:


Year  Jan Feb


1969 5.5 1.0


1983 6.7 1.7


Cranleigh, Surrey
Lionel Hutz
04 January 2020 22:10:23


I've been looking through the CET monthly means for past Januaries and Februaries, to see what the biggest falls from one month to the next have been. In recent times, they seem to have been:


Year  Jan Feb


1969 5.5 1.0


1983 6.7 1.7


Originally Posted by: jhall 


👍 A very interesting counterpoint to the occasional "winter is over" post that we see from one or two others.


Lionel Hutz
Nr.Waterford , S E Ireland
68m ASL


tallyho_83
04 January 2020 22:27:08


On Tuesday evening/night - 'P.P.P.P PICK UP A PIZZA!'


Definitely one to bank Just for the wrong reason.


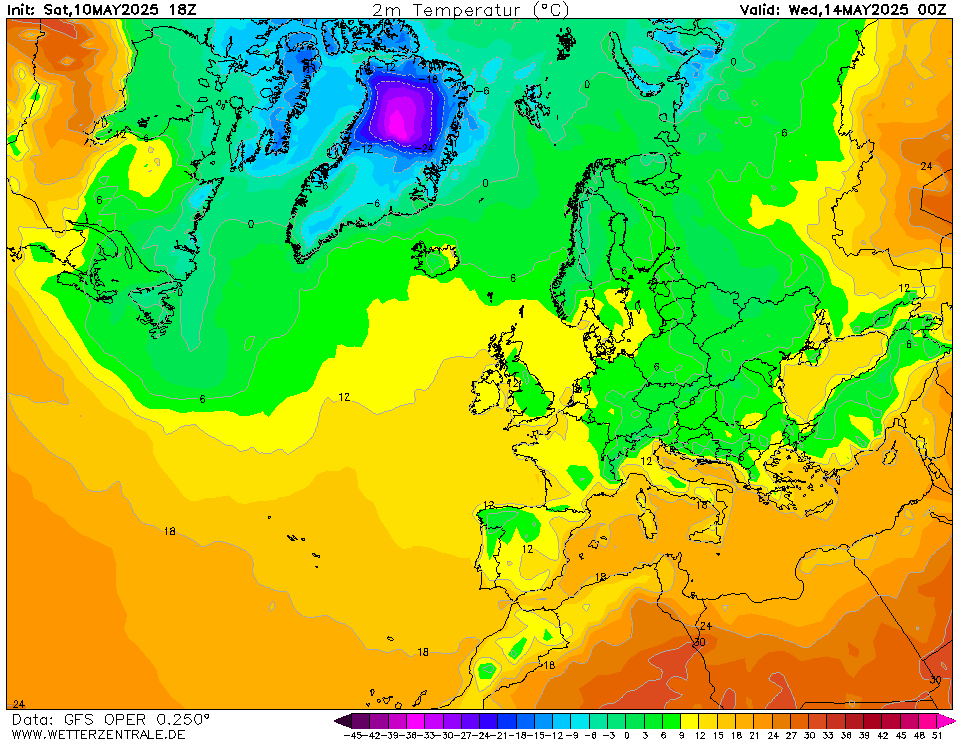
Laughs out loud @ how that warm air-mass fit's directly over the UK only - Ok the most of Europe is well above average given it's 1 or 2 hrs ahead at the most. You have 0C as far north as Greenland sea and almost reaching as far north as Svalbard! - Such remarkable mid winter warmth. - I think this warm air-mass originated from the Tropical Atlantic maybe the Caribbean? Average temperature for Jan in Svalbard is around -15c to -17c. If this temp chart comes about then Svalbard could be (almost) some 20c above the seasonal average. As summer temps in Svalbard are just above freezing at 3c. Svalbard is some 77.8° N. 
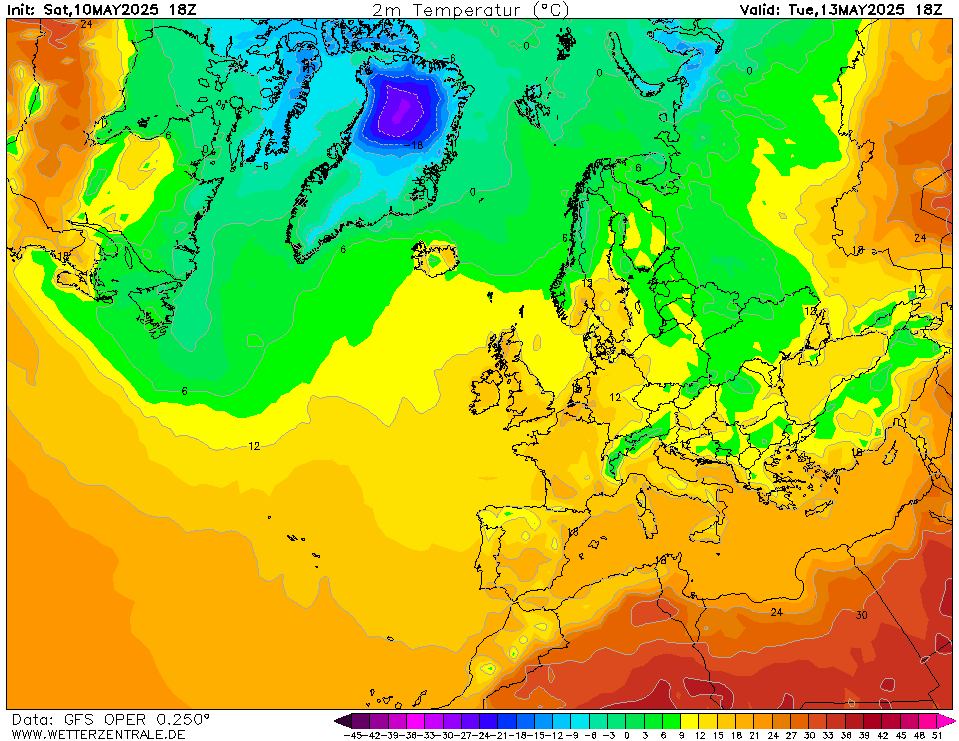


The 0c does reach southern Svalbard:


- early hrs of Wednesday morning, - How erratic.


Home Location - Kellands Lane, Okehampton, Devon (200m ASL)
---------------------------------------
Sean Moon
Magical Moon
www.magical-moon.com


picturesareme
04 January 2020 23:01:29


On Tuesday evening/night - 'P.P.P.P PICK UP A PIZZA!'


Definitely one to bank Just for the wrong reason.


Laughs out loud @ how that warm air-mass fit's directly over the UK only - Ok the most of Europe is well above average given it's 1 or 2 hrs ahead at the most. You have 0C as far north as Greenland sea and almost reaching as far north as Svalbard! - Such remarkable mid winter warmth. - I think this warm air-mass originated from the Tropical Atlantic maybe the Caribbean? Average temperature for Jan in Svalbard is around -15c to -17c. If this temp chart comes about then Svalbard could be (almost) some 20c above the seasonal average. As summer temps in Svalbard are just above freezing at 3c. Svalbard is some 77.8° N. 


The 0c does reach southern Svalbard:


- early hrs of Wednesday morning, - How erratic.


Originally Posted by: tallyho_83 


20C above? Erm not on this chart they're not.. look to be no milder then around -6C over the svalbard and more typically below -9C.


Unless of course your talking about Jan Mayen which is located some distance from svalbard? Jan has an average January high of -3C.

BJBlake
05 January 2020 00:27:28
There is a tendency for easterly QBOs to be stronger than westerly ones, and do more to disrupt and interfere withe the Troposphere, with SSW events more likely.

Currently the QBO is in its westerly phase,which amplifies the jet stream, with a trend therefore to relentless, wet, stormy and mild winters for NW Europe and mild winters for NE USA too.

I am not sure when the 28-29 months are up and therefore when the QBO will switch back to easterly - but I think it is around March.

Could this mean another beast from the east in mid March...Id prefer Feb, but I'll take it
If it arrives in March.
Brecklands, South Norfolk 28m ASL
tallyho_83
05 January 2020 01:41:04

There is a tendency for easterly QBOs to be stronger than westerly ones, and do more to disrupt and interfere withe the Troposphere, with SSW events more likely.

Currently the QBO is in its westerly phase,which amplifies the jet stream, with a trend therefore to relentless, wet, stormy and mild winters for NW Europe and mild winters for NE USA too.

I am not sure when the 28-29 months are up and therefore when the QBO will switch back to easterly - but I think it is around March.

Could this mean another beast from the east in mid March...Id prefer Feb, but I'll take it
If it arrives in March.

Originally Posted by: BJBlake 


We should be transferring to an easterly phase of the QBO anyway - last year we went from easterly to westerly and this resulted in a very mild /exceptionally warm February. But the USA esp central mid western parts of the states had a really cold January and February as the QBO went to it's westerly phase.


I have always wondered if there is a connection between an easterly QBO and the increased chances of a SSW? We haven't really discussed this much and there is a confusion as to what causes a SSW - esp for me. Anyone? What is the cause of a SSW?


Are you suggesting that SSW are more likely to occur with an easterly QBO? Just wondering? Thanks.


Home Location - Kellands Lane, Okehampton, Devon (200m ASL)
---------------------------------------
Sean Moon
Magical Moon
www.magical-moon.com


DEW
  • DEW
  • Advanced Member
05 January 2020 07:34:10

Never mind the SSW and QBO - as Alan Sugar said apropos taking an early morning swim in the pool aboard his yacht "I have people to dd that for me" - and in this thread the people doing it for me are the GFS and ECM chart makers.


And they're still firmly in favour of the HP/zonal set up as of yesterday. GFS has the HP further south and the westerlies rather stronger, and indeed a small trough far enough south to affect all areas on Fri 10th (there have been suggestions of this previously but now showing as a more definite feature). On 14th to 17th deeper LP from the Atlantic are due to give the NW especially the Western Isles a rough time but pass on by without much affecting HP to the south.


ECM in general agreement though end of run on Wed 15th has the storms affecting the whole west coast


GEFS temps have acquired more definite predictions since yesterday, with values up and down until 14th Jan, above and (briefly) below average, which looks like the passage of alternating warm and cold sectors. After this less certainty but nothing really cold. Generally wetter than yesterday with the 14th-17th spell showing up, though still dry-ish in the SE. Rain from the trough on the 10th is present as a spike maily in the far S


I can't see any significant change in the pattern of our weather looking at the GEFS postage stamps all the way out to T+384


War does not determine who is right, only who is left - Bertrand Russell

Chichester 12m asl
Retron
05 January 2020 07:39:50


I can't see any significant change in the pattern of our weather looking at the GEFS postage stamps all the way out to T+384


Originally Posted by: DEW 


I can't say I've ever seen such a sustained run of poor ensembles (in terms of cold) this millennium. It really is remarkable just how few -10s there are; after a couple of days last week with a handful per run in GEFS (and one or two in EPS), both models have now reverted to none.


The overwhelming signal is as it has been all winter: sustained mild weather with no end in sight.


(It will, of course, come to an end eventually, but it's unlikely to be in the next 10 days at least.)


Leysdown, north Kent
David M Porter
05 January 2020 09:26:32


We should be transferring to an easterly phase of the QBO anyway - last year we went from easterly to westerly and this resulted in a very mild /exceptionally warm February. But the USA esp central mid western parts of the states had a really cold January and February as the QBO went to it's westerly phase.


I have always wondered if there is a connection between an easterly QBO and the increased chances of a SSW? We haven't really discussed this much and there is a confusion as to what causes a SSW - esp for me. Anyone? What is the cause of a SSW?


Are you suggesting that SSW are more likely to occur with an easterly QBO? Just wondering? Thanks.


Originally Posted by: tallyho_83 


What would be interesting for me to find out is what phase the QBO was in back in February 2018 when the SSW happened during that month which led to the Beast from the East event at the end of that month and the start of March.


Lenzie, Glasgow

"Let us not take ourselves too seriously. None of us has a monopoly on wisdom, and we must always be ready to listen and respect other points of view."- Queen Elizabeth II 1926-2022
Sasa
  • Sasa
  • Advanced Member
05 January 2020 09:30:36
Eventually being the key word here. I am so worried by the prospects of forthcoming spring or summer being exceptionally poor.
Kingston Upon Thames

Remove ads from site

Ads